
TT Analyzer
Measure scanning quality
Optimize with confidence
Professional digitization requires more than a good visual impression. It requires confidence. The TT Analyzer software makes scanning quality measurable, reproducible and compliant to standards — in one simple process.
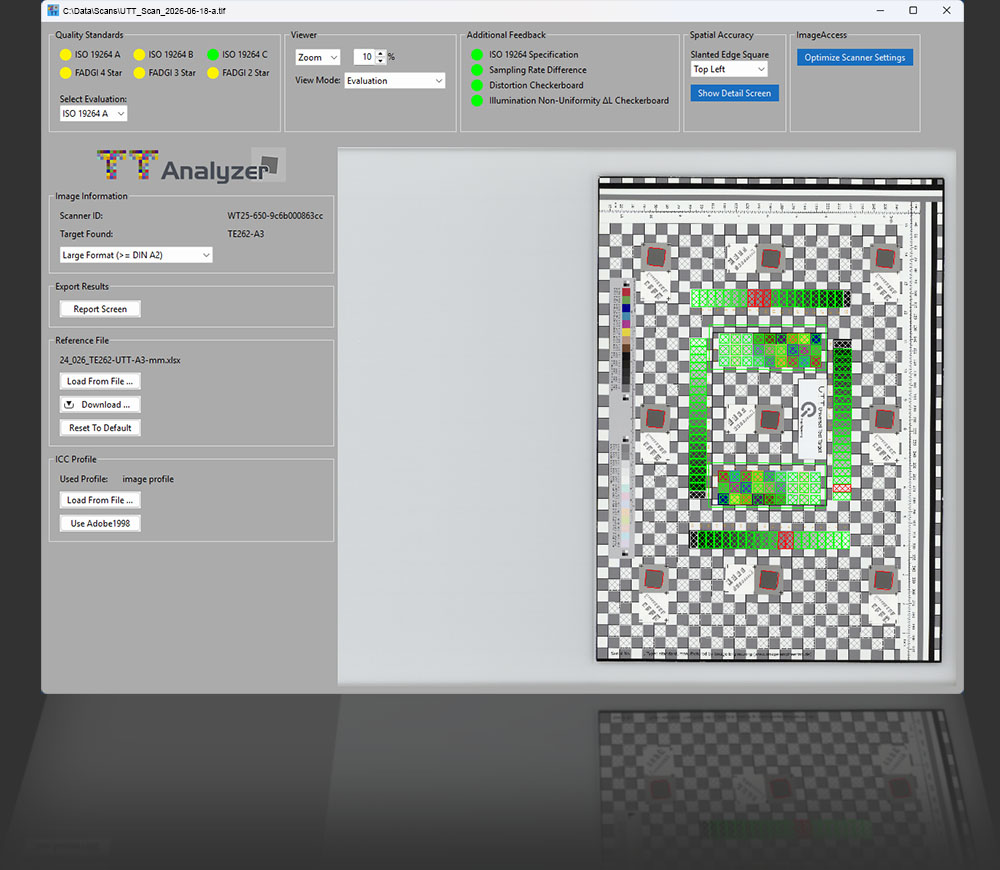
One application for reliable scan quality
Evaluation
The TT Analyzer evaluates scans against international standards like ISO 19264 and FADGI.
Results are clearly visualized using an intuitive traffic light system.
1-Click-Optimization
The software identifies deviations from reference data from test targets and translates them into scanner optimization and calibration parameters — with just one click.

Certification
Users can generate a detailed certificate documenting that the scan meets the selected ISO 19264 or FADGI quality criteria.
A4 Target Support
The TT Analyzer works with UTT and GoldenThread targets — and also supports the compact DIN A4 UTT as a cost-effective option for professional quality control.
Standards-based quality control matters
A scan may look good at first glance — but professional digitization requires measurable proof. The standards ISO 19264 and FADGI define how accurately a scanner reproduces color, detail, geometry and tonal values.

The TT Analyzer evaluates scans against these criteria, making image quality objective, comparable, reproducible and reliable.

See the difference a single click can make
Quality deviations are not just displayed — they are the starting point for scanner optimization. Once the analysis is complete, the TT Analyzer turns the evaluation results into optimization and calibration values, which can be applied directly to the Image Access scanner.
With a single click.
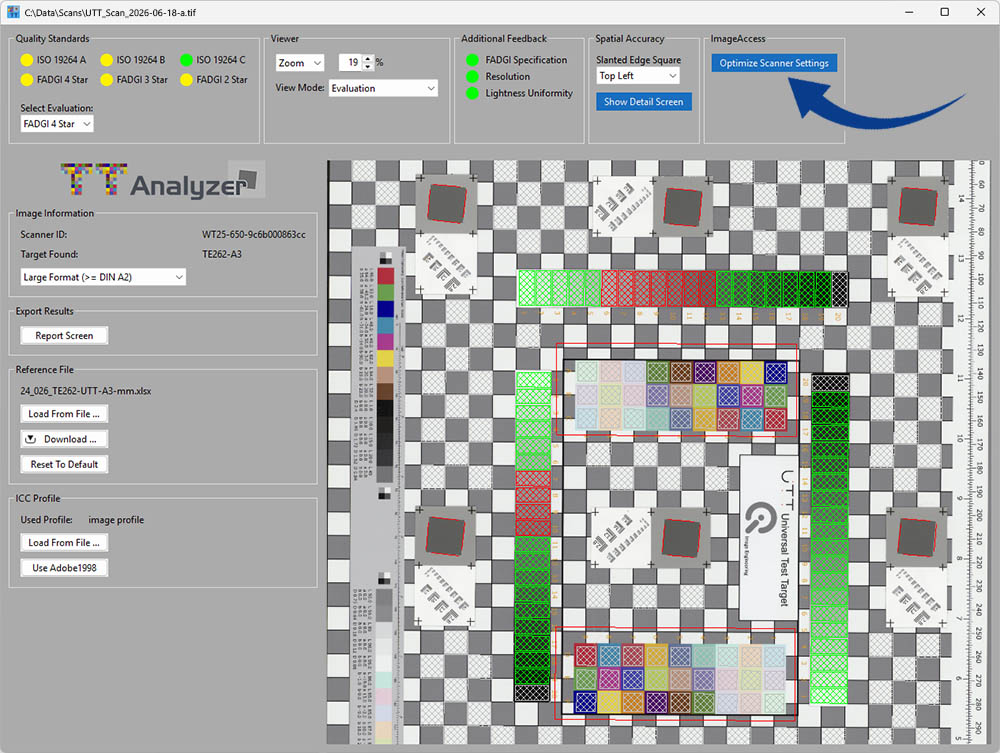
Before optimization: No Compliance
In this case, the red markings on the grey ramp indicate measurable deviations from the selected standard FADGI ****.
The current scanner settings do not yet meet the required image quality criteria.
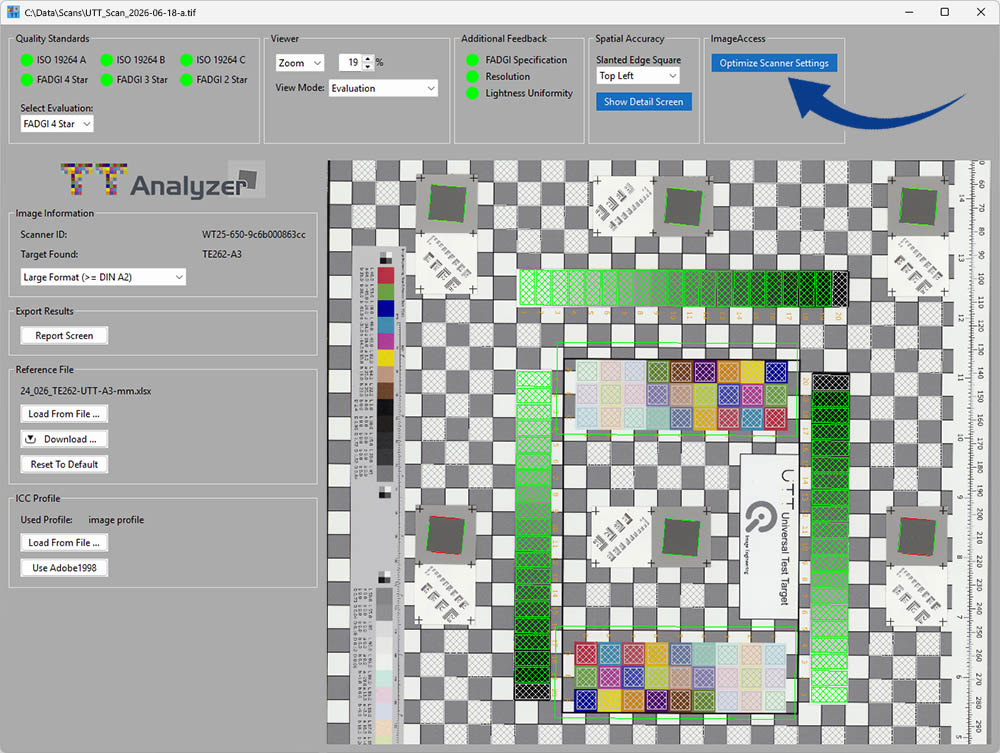
After optimization: Compliance achieved
The green markings on the grey ramp indicate the measured values fullfil the selected standard FADGI ****.
The scanner settings meet the required image quality criteria.
Before optimization: No Compliance
In this case, the red markings on the grey ramp indicate measurable deviations from the selected standard FADGI ****.
The current scanner settings do not yet meet the required image quality criteria.
After optimization: Compliance achieved
The green markings on the grey ramp indicate the measured values fullfil the selected standard FADGI ****.
The scanner settings meet the required image quality criteria.
Good to know: Optimization values are applied directly into the scanner itself — not just in external software.
This guarantees standard-compliant images, from wherever the scan is initiated.
Full expert control
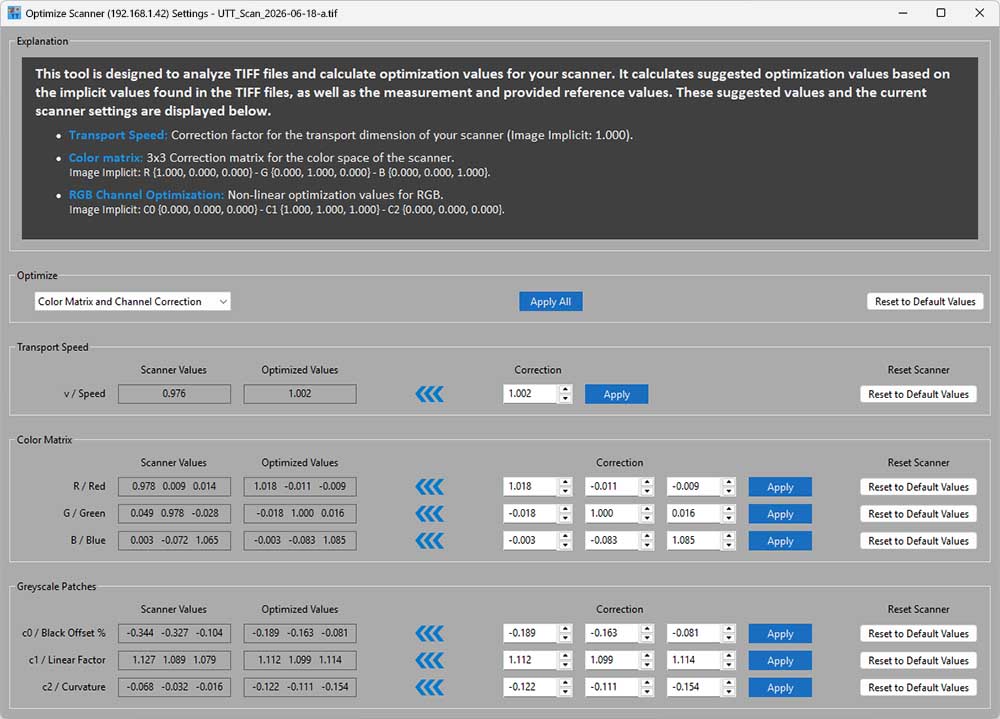
Although the TT Analyzer simplifies scanner optimization, expert users remain in full control. Every parameter stays accessible for precise and expert fine-tuning.
Professional tools in one clear interface
The TT Analyzer brings technical quality evaluation into a clear visual workflow. Users can quickly see which criteria are fulfilled, where deviations occur and what needs attention.
Evaluation results are displayed in an intuitive traffic light system, making scan quality easy to understand at a glance.

Intuitive traffic light system
Instead of complex tables or technical data, the TT Analyzer presents evaluation results in an intuitive traffic-light system.
Simply switch between supported standards and immediately see whether the scan meets the selected ISO 19264 or FADGI criteria.
Informative viewer
All analysis information is visualized directly in the viewer. Users can switch between evaluation modes such as background, grayscale patches, white balance, color fields, distortion and target ROI to quickly identify relevant scan quality details.
Detailed analysis view
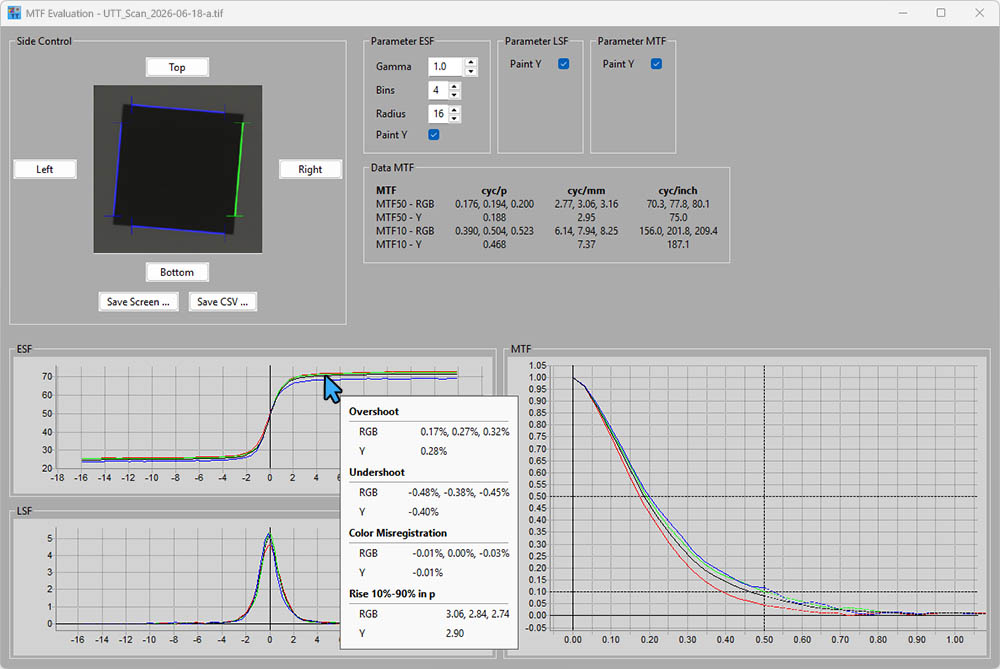
Open the detail screen to inspect the data behind the evaluation — from additional quality checks to spatial accuracy, including MTF, ESF and LSF charts for sharpness, edge response and detail reproduction.
1-Click-Scanner-Optimization
The TT Analyzer identifies deviations from reference data and translates them into actionable scanner optimization values, which can be applied directly to the scanner with a single click.
For expert users, every setting can be controlled manually.
Works only with Image Access Scanners
Certification and detailed report
Generate a detailed certificate confirming that the scan has passed the selected ISO 19264 or FADGI quality criteria.
For deeper documentation, the underlying evaluation data can also be exported as CSV with measured and reference values side by side.
Target-specific reference data
If available, target-specific reference data can be loaded to increase the accuracy of both evaluation and scanner optimization.

Evaluation
Displays the evaluation against the selected scanning standard

ΔL Background
Makes background lightness deviations easy to identify

ΔL Greyscale Patches
Visualizes tonal accuracy across the grayscale areas

ΔE White Balance
Highlights deviations in neutral color balance

ΔE Color Fields
Shows how accurately defined color patches are reproduced

Distortion
Reveals geometric deviations and possible image deformation

Target ROI
Shows the detected target area used for measurement
Intuitive visualization
The integrated viewer makes scan quality easy to understand at a glance. Different visualization modes highlight relevant analysis data directly on the target image — from background and grayscale deviations to white balance, color fields, distortion and detected target area.
Complex data, clearly structured
For advanced quality evaluation, the TT Analyzer displays MTF, ESF and LSF values in clear measurement charts. This allows users to objectively assess sharpness, edge response and detail reproduction — with complex image quality data presented in a structured and easy-to-read format.
A complete quality-control workflow
1
Scan target
2
Load image
Automated analysis
3
Optimize with one click
4
Re-scan & re-analyze
Standardized targets, objective results
The TT Analyzer uses standardized test targets to evaluate scan quality based on defined reference values. Color patches, grayscale fields and resolution structures provide the measurable basis for analyzing key image quality parameters — from color accuracy and tonal response to sharpness, geometry and detail reproduction.
Supported targets:
Universal Test Target / UTT
Universal Test Target / UTT A4
GoldenThread DICE Target
GoldenThread FADGI 19264 Target

Universal Test Target / UTT
The Universal Test Target is a comprehensive reference target for standards-based scanner quality evaluation. It combines defined grayscale steps, color patches, slanted-edge elements, resolution patterns, checkerboard structures and measurement scales to support objective analysis of key image quality parameters such as color reproduction, tonal response, sharpness, spatial accuracy, uniformity and distortion.
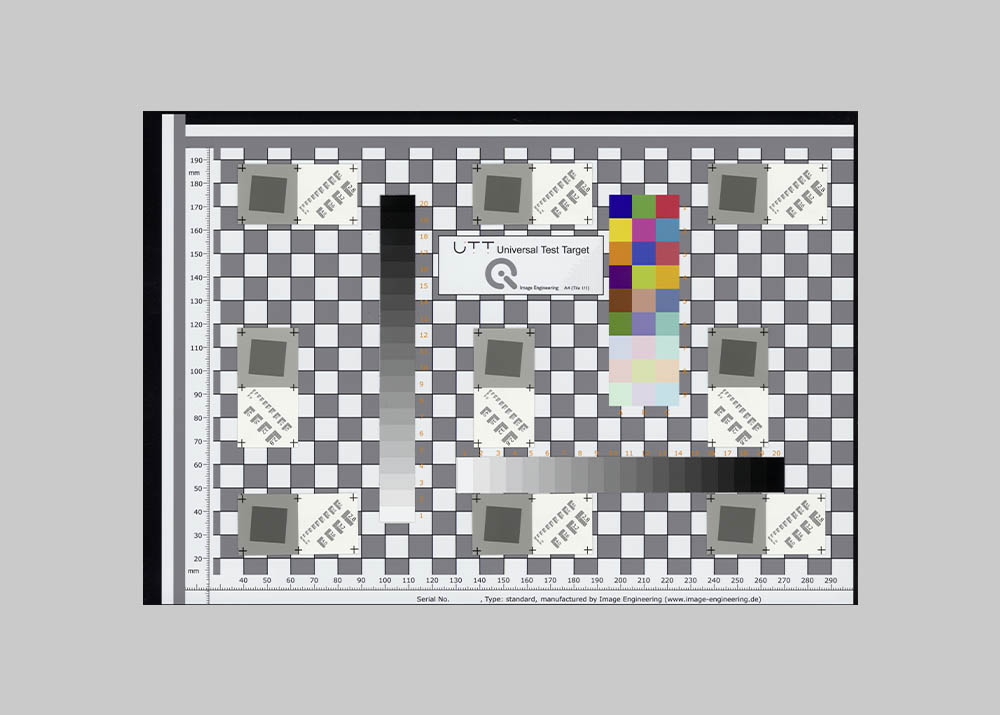
Universal Test Target / UTT A4
The compact A4 UTT brings the UTT-based evaluation concept into a smaller and more cost-effective target format. With defined grayscale, color, slanted-edge and resolution elements, it provides a reliable basis for objective scan quality analysis while making professional, standards-based quality control more accessible.
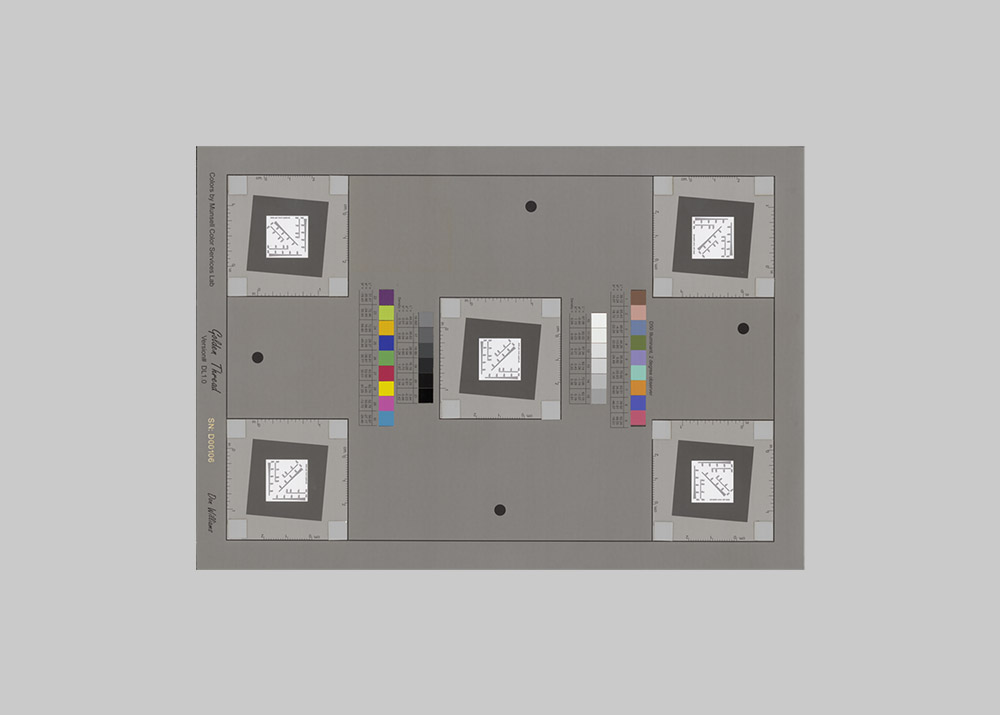
GoldenThread DICE Target
The GoldenThread DICE Target is an established target for scanner benchmarking and session-to-session quality control. It supports objective evaluation of key image quality parameters such as resolution, color, tone, noise and sampling rate, while also providing data for illumination uniformity, spatial distortion and resolution consistency.

GoldenThread FADGI 19264 Target
The GoldenThread FADGI 19264 Target is the updated GoldenThread target for advanced FADGI and ISO 19264-oriented quality evaluation. With expanded color information and additional measurement features for lighting uniformity and geometric distortion, it provides a detailed reference for standards-based scan quality analysis.

Quality you can certify
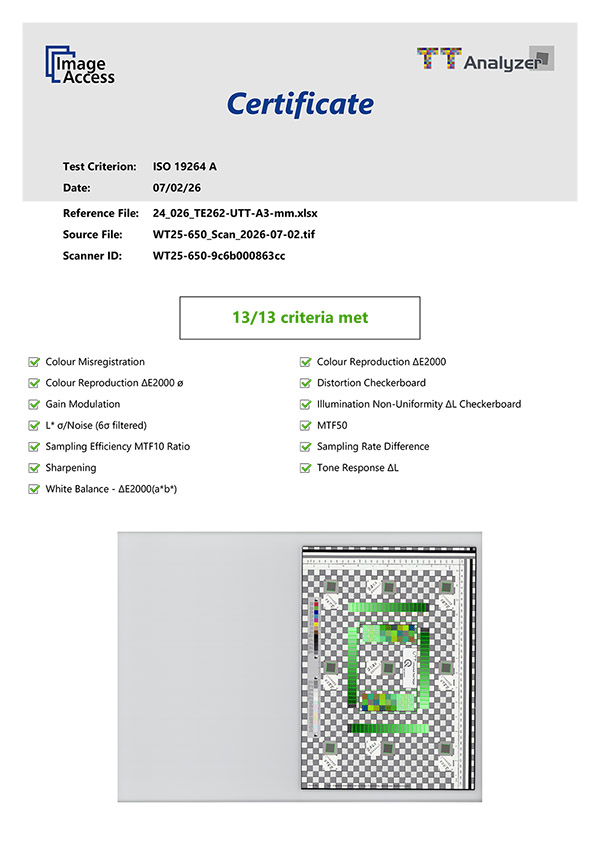
Clear proof of compliance
After a successful analysis, the TT Analyzer can generate a detailed certificate confirming that the scan has met the selected ISO 19264 or FADGI quality criteria. The certificate documents the test criterion, source file, scanner ID and all passed evaluation points — creating clear proof for professional quality control workflows.
Need the data behind the evaluation? Export them as CSV file.
All evaluation data can be exported with measured values and reference values side by side — ideal for documentation, comparison and external analysis.
Built for professional digitization workflows
Archives
Traceable long-term quality
Libraries
Reliable book digitization
Museums
Documented cultural heritage quality
Government
Audit-ready digitization
Service Providers
Verifiable customer results

Your interest, our expertise
Contact us now and explore a new dimension in scanning technology!